Log files are boring.
Yep, I said it. They’re overwhelming and while it’s not hard to build a report around them, you often need to import the data into another tool like Excel to make it truly easy to understand. From there, if you need high level insights for consistent reporting, you might need to clean up the data or manipulate it. In today’s day and age of active threat monitoring and constant report building, there needs to be a better way to visualize file data.
That’s why interactive visual analytics tools are necessary and exactly why we built our SmartStats visual dashboard for our on-prem customers. The goal? To give you a quick way to breakdown audit data regarding your files and users. But telling you about it is one thing, showing you is another. Here are 3 videos that show you the power of visual file analytics.
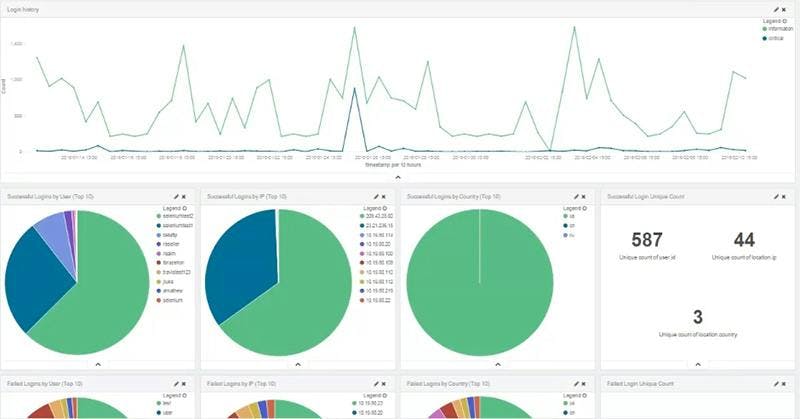
Visual File and User Analytics to Monitor Login Attempts
This video not only shows you how to look at logins in your office, but how to flip it to spot login attempts (typically failed) from unusual locations with just a few clicks.
Visual File and User Analytics to Sort Audit Information
This video shows you how to quickly sort through that unbearable audit log. This gives you faster reporting.
Visual File and User Analytics Dashboard
Here we show you how the SmartStats dashboard can be updated with new reports in just a few clicks. This dashboard then allows you to monitor key indicators quickly and gives your boss assurance that you are constantly monitoring important data points.
Concluding Thoughts
SmartStats help SmartFile enterprise customers understand their file activity and access in a quicker way. Make sure to contact sales@smartfile.com if you’re interested in learning more! By the way, kudos to Alex Kubacki, our Linux Administrator, for making these awesome videos!