Chrome has tons of tools, for the everyday user and for developers and sysadmins. One such tool is the little known Chrome net-internals application, which is accessible by typing chrome://net-internals into your Chrome browser.
What is net-internals? Per the Chromium Project, Net-internals is a “visualizer for the NetLog event stream. It can be used both in real-time, and also to load up post-mortem NetLog dumps.” Essentially, it’s a real time look at network data, allowing you to download logs and see visuals of network data. It’s often used for debugging purposes.
What network bugs can net-internals help you identify?
There’s several network issues or bugs this can help you identify. Here’s a good list from the Chromium Project:
- Cache hits for DNS resolves
- Reads/writes from disk cache
- Queueing delay to schedule DNS resolves to threads
- Stalls due to chrome extensions pausing requests
- Stalls due to exceeding socket pool limits
- Speculative DNS resolves
- Proxy resolution
- Attempts to do a TCP connect to an IP address
- Network change events
- Proxy configuration change events
- Other Errors
The Chromium Project goes a bit further and states that this is not a replacement for packet captures like tcpdump but it’s actually used for “application level logic and caches” that are not known at lower layers. It can also capture bytes sent and/or received over sockets.
Using Net-internals to Get Network Data for Bug/Error Reports
If you have an issue and need to send it to a developer to fix, here’s how you can gather the network data from net-internals:
- Start a new browser window and go to chrome://net-internals
- If you need byte-level data, select “Capture” from the drop down menu that’s in the top left, then check “Include the actual bytes sent/received.”
- Replicate the network problem in another tab in the same browser window. Do this after opening Chrome’s net-internals
- In the net-internals tab, enter some information regarding the issue into the open text box and click “Save to File.” If you switched to the “Capture” page in step 2 then you’ll first need to select “Export” from the top-left.
- (OPTIONAL) Edit the log to remove any personal information, but make sure the code is still usable
- Either attach the log to a bug in crbug.com, or send email to the bug investigator. Include any relevant data or URLs.
- If the problem occurs very early and you cannot enable logging through chrome://net-internals, you can add a command line argument to Chrome to start logging as early as possible:
–log-net-log=C:\some_path\some_file_name.txt
For info about adding command line options see command-line-flags
Using net-internals to visualize captured events
You can visualize many events with net-internals as well. This includes open sockets, in-use sockets, DNS jobs, URL requests and bytes sent/received.
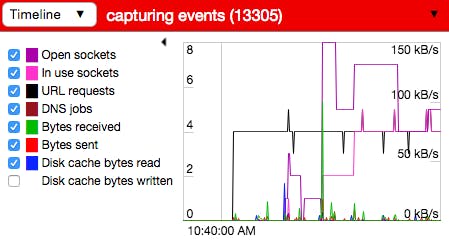
This gives you a pretty good understanding of what is happening as you replicate a process. It’s worth noting this will capture events for every open tab, so only have issue-causing tabs open. Yep, that means close down those cat videos.
Conclusions on using chrome://net-internals
Net-internals is a good way to debug your network. As always, make sure if you’re sharing your logs or data with people outside your organization to remove personally identifiable information.